Gold – Drops Sharply to Below $1140
In the last few weeks gold has fallen very strongly and resumed the medium term down trend falling from above $1250 back down through the key $1240 level, down below $1200 to a multi year low around $1140. In the few days to start this week gold was able to find support at $1160 and consolidate after its very strong fall, before falling again strongly in the last 24 hours. A few weeks ago Gold ran into the previous key level at $1240, however it also managed to surge higher to a five week high at $1255. After enjoying some solid support at $1215 for a couple of weeks, gold dropped to its lowest level in 2014 near $1180 earlier this month.
Now that the key $1200 level has been broken, this level is likely to play a role should gold rally again. In late August Gold enjoyed a resurgence as it moved strongly higher off the support level at $1275, however it then ran into resistance at $1290. In the week prior, Gold had been falling lower back towards the medium term support level at $1290 however to finish out last week it fell sharply down to the previous key level at $1275. During the second half of June, gold steadily moved higher but showed numerous incidents of indecision with its multiple doji candlestick patterns on the daily chart, around $1320 and $1330. The OANDA long position ratio for Gold has eased back to 65% as gold has dropped very sharply back down below $1140.
At the beginning of June, gold did very well to repair some damage and return to the key $1275 level, then it has continued the momentum pushing a higher to its recent four month high. After moving so little for an extended period, gold dropped sharply back in May from above the well established support level at $1275 as it completely shattered this level falling to a four month low around $1240. It remained around support at $1240 for several days before its strong rally higher. It pushed down towards $1280 before sling shotting back and also had an excursion above $1300 for a short period before moving quickly back to the $1293 area again.
Gold settled below $1,150 per ounce on Wednesday, opening the way for a fall to $1,000 as a surging dollar and stronger share prices weaken the investment case for non-yielding bullion. Gold futures for December ended the session around 2 percent lower at $1,145.70 an ounce, down $22.00 on the day. Spot gold, which skidded to its lowest since April 2010 at $1,137.10 an ounce earlier, was last down 1.8 percent at $1,147. The metal has lost around $100 an ounce over the past week, rekindling memories of a stunning two-day drop last year that started a huge wave of divestment and a surprise double-digit annual price dive after 12 years of gains.
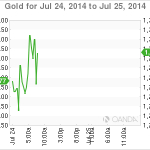
(Daily chart / 4 hourly chart below)


Gold November 5 at 22:45 GMT 1140.9 H: 1169.9 L: 1137.8
Gold Technical
![]()
During the early hours of the Asian trading session on Thursday, Gold is trading in narrow range between $1140 and $1150 after falling very sharply to close out last week and to start this new week. Current range: trading right around $1140.
Further levels in both directions:
• Below: 1140.
• Above: 1200 and 1255.
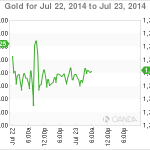
OANDA’s Open Position Ratios
![]()
(Shows the ratio of long vs. short positions held for Gold among all OANDA clients. The left percentage (blue) shows long positions; the right percentage (orange) shows short positions.)
The long position ratio for Gold has eased back to 65% as gold has dropped very sharply back down below $1140. The trader sentiment is strongly in favour of long positions.
Economic Releases
- 00:30 AU Unemployment (Oct)
- 05:00 JP Leading indicator (Prelim.) (Sep)
- 09:30 UK Industrial Production (Sep)
- 09:30 UK Manufacturing Production (Sep)
- 12:00 UK BoE MPC – APF Total (Nov)
- 12:00 UK BoE MPC – Base Rate
- 12:45 EU ECB – Interest Rates
- 13:00 EU Euro-Area Finance Ministers Meet in Brussels
- 13:30 CA Building permits (Sep)
- 13:30 US Initial Claims (01/11/2014)
- 13:30 US Non Farm Productivity (Prelim.) (Q3)
- 13:30 US Unit Labour Costs (Prelim.) (Q3)
- 15:00 CA Ivey PMI (Oct)
- 15:00 UK NIESR GDP Est. (Oct)
- JP BoJ release minutes
* All release times are GMT
This article is for general information purposes only. It is not investment advice or a solution to buy or sell securities. Opinions are the authors; not necessarily that of OANDA Corporation or any of its affiliates, subsidiaries, officers or directors. Leveraged trading is high risk and not suitable for all. You could lose all of your deposited funds.
Source: marketpulse – Gold – Drops Sharply to Below $1140