


Elliott Wave Analysis: Bulls Pushing Price Higher On USD Index; 99 Zone Could Be Reached
 On USD index daily chart we are observing a big sideways pattern since start of 2015; it’s slow, sideways and overlapping price action which is a personality of a contra-trend movement that can be completed now. We see it as a flat correction in black wave IV; a three wave structure where final wave C should be made by five waves. Well, we have seen a nice decline from November of 2015 counted in five legs, but as an ending diagonal. That’s a reversal pattern that already caused a strong bounce in May, so ideally recent sharp leg down was just a pullback labeled as wave two within ongoing uptrend and recent sharp turn to the upside is undergoing wave 3, which could ideally reach 99 region.
USD Index, Daily

Click to Enlarge
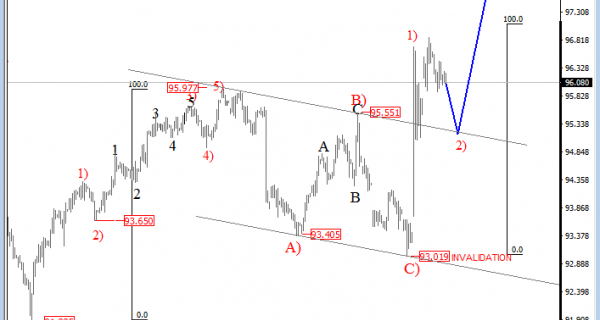
On the lower time frame, price made a nice reversal higher at 93.00 area where a three wave corrective retracement had completed. Now we think that price could already be in a new bullish sequence which can reach for 98.60 area in days ahead, where 161.8 Fibonacci projected level can be met.
USD Index, 4H

Click to Enlarge
http://www.ew-forecast.com/service
Find more: Contributing Authors
Related Posts
 Elliott Wave Analysis: Bullish Momentum Continues
 Elliott Wave Analysis: Bears Pushing Price Lower; The Fifth And Final Wave Can Be In Play
  Elliott Wave Analysis: Big Corrrection On AUDUSD Looks Completed; More Weakness May Follow
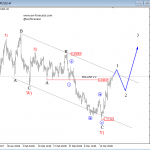 Elliott Wave Analysis: EURUSD and GBPUSD
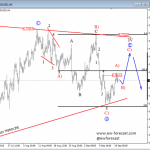 Elliott Wave Analysis: Triangle Point Lower On The AUDUSD


