Elliott Wave Analysis: GOLD And USDCAD
 Elliott Wave Analysis: GOLD And USDCAD
GOLD
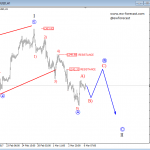
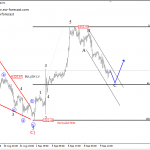
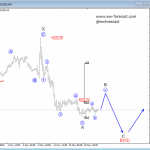
On the intraday chart of GOLD we are observing a part of a higher degree impulsive wave taking place, that seems to be as of recent intraday activity acomplished. The reason we think this higher degree impulse could be completed is a five wave structure within it, with blue wave 5-circled being the final wave. If that is the case then recent bullish intraday activity is the start of a probable three wave rise into waves A,B and later C.
The whole correction that may unfold in the coming weeks, may find some resistance and a turning point lower around the area of the previous wave 4, near the 1231 level.
GOLD, 1H

Click to Enlarge
USDCAD
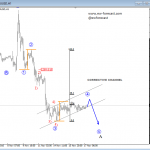
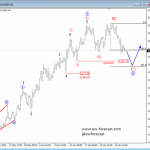
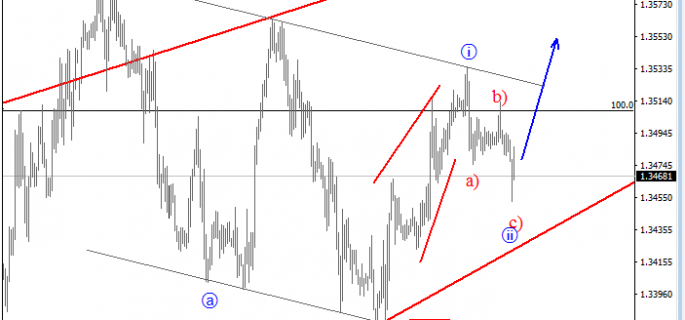
Regarding the intraday view of USDCAD, we see this pair trading in final stages of a higher degree ending diagonal, that could find a top and a reversal zone around the 1.3600 region. But firstly we need three more waves to unfold within black wave C of 5), before this reversal lower may take place. As we see on the chart, currently we think price could be trading in final stages of the second sub-wave ii, that could in the next few sessions point towards more gains.
Invalidation level is at 1.3378- as long as price keeps trading above this level we are looking bullish.
USDCAD, 1H

Click to Enlarge
http://www.ew-forecast.com/service
Find more: Contributing Authors