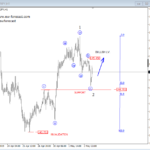
Elliott Wave Update: GBPJPY Can See More Upside Near-term!


GBPJPY unfolded a five-wave drop from the 200.0 region which is now being followed by a contracting development, a wave B triangle. A triangle is a continuation pattern, and unfolds prior to the final leg, so be aware of more weakness once the triangle in B fully develops.
That said, now price can be unfolding leg C, so be aware of a temporary turn up towards the 149.13 possible resistance region.
GBPJPY, Weekly

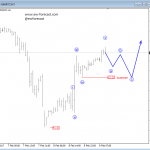
On the daily chart of GBPJPY we labelled a double zig-zag corrective rally from the lows, which is now unfolding its second leg A) of C, and which can face resistance near the 142.0/143.0 region, from where wave B) temporary pullback may start to form.
GBPJPY, Daily

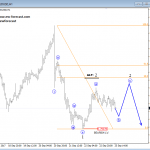
On the 4h chart, however, we labelled latest sideways price activity as a potential triangle in the making within an already unfolding wave B), that is still missing one leg lower, before a rally towards new highs.
The other option for the GBJPY 4h chart can also be a sideways price activity within a wave four of a lesser degree, of a wave A), which also points higher. So, in either case more upside is expected once this minor triangle fully shows up.
GBPJPY, 4h

Disclosure: Please be informed that information we provide is NOT trading recommendation or investment advice. All of our work is for educational purposes only.
http://www.ew-forecast.com/service
Find more: Contributing Author